References/links:
- Fluke 287
- Fluke IR189USB USB Cable adapter
- FlukeView Forms
- Fluke 28x Remote Interface Specifications
- PySerial library
- PuTTY
The Fluke 287 has a very nice build-in data logger. You can use it to log your data, view them on the screen or download them to your PC with FlukeView Forms. The minimum logging period is 1 second but it also logs events that happen between measurements.
I scored an IR189USB cable some time ago and wanted to see if I could read data without the Fluke software. It turns out that the 287 has a surprisingly easy serial interface. For the full set of commands consult the Remote Interface Specifications manual.
Unfortunately a serial port cannot turn the knob. The instrument has to be setup manually beforehand.
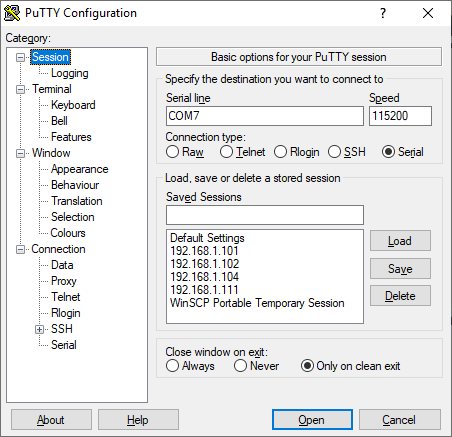
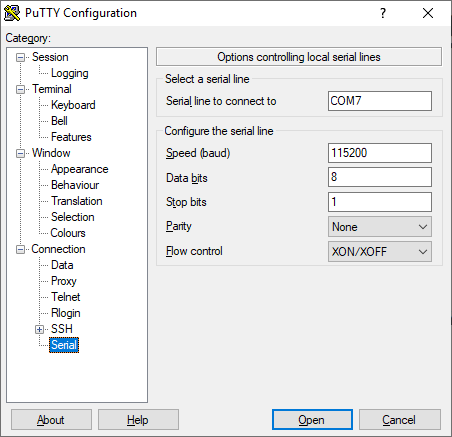
Quick test of the connection with PuTTY
Connect the IR189USB cable to the 287 and PC. Find the COM port number that the cable occupies. Mine is COM7. Run PuTTY. In the setup window choose the following settings:
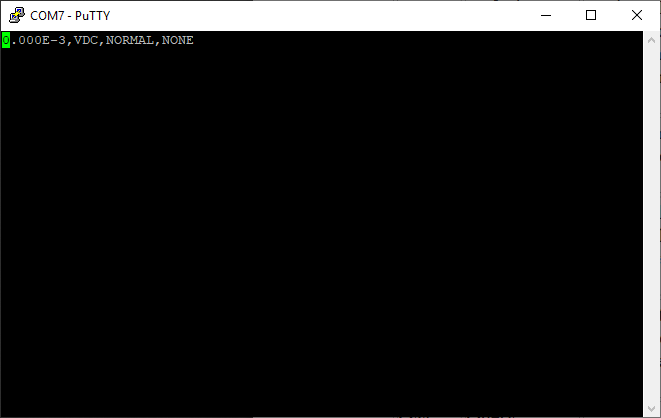
Now click open. Type Q M [Enter]. This command reads the primary measurement. If the instrument is connected you should see something like the following:
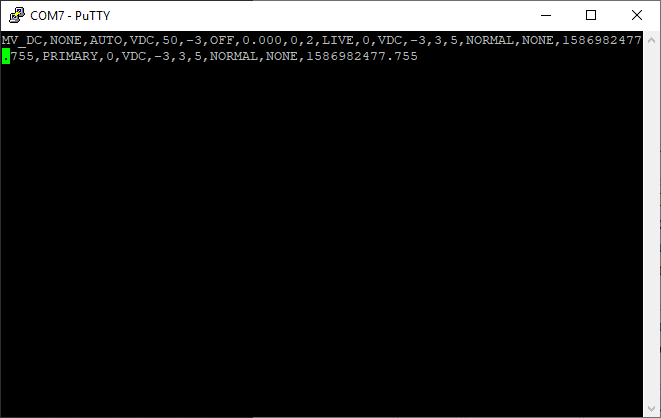
Now type Q D D A [Enter]. This command reads all the information displayed on the screen. You should see something like this:
Reading the values with Python
I thought it would be useful to write some code for future automated measurements. All the things mentioned here should also work for the Fluke 289.
I developed the code in Python 3.8.2 but it should work with any version. The only non-standard library needed is PySerial. I should also warn you that I am not a programmer, just a grease monkey. So don't laugh at the code.
The program takes a measurement every n second and stores the results in a CSV file. You can setup the logging parameters in the first lines of the script.
Testing
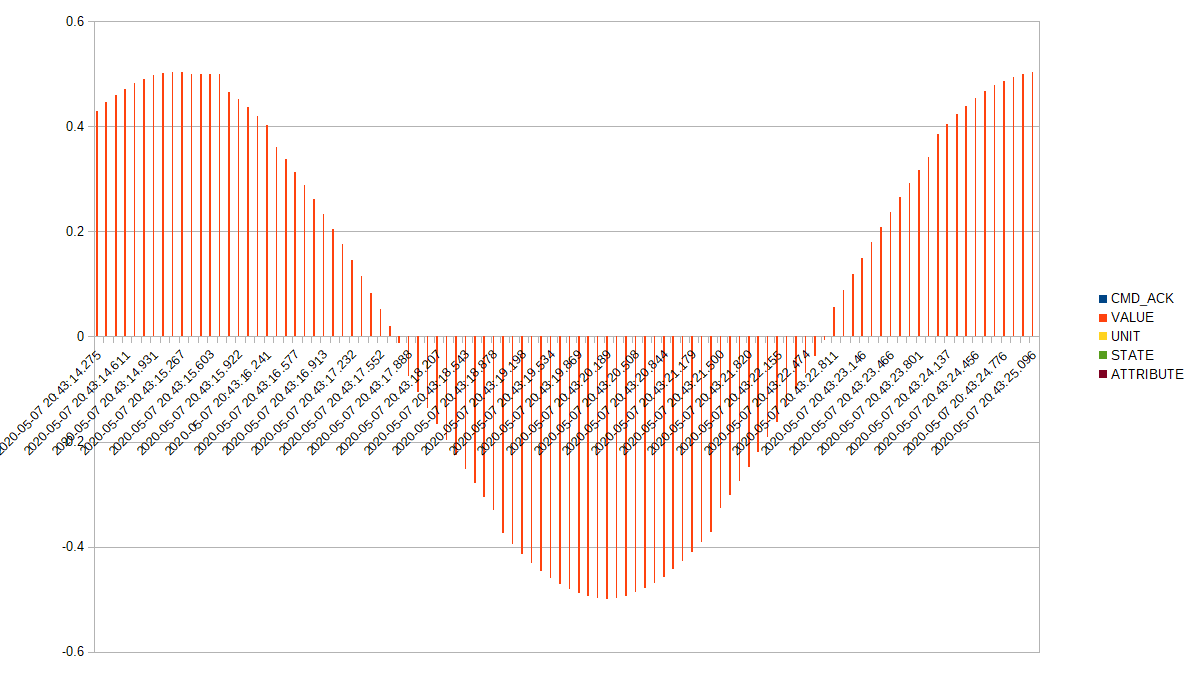
Now lets measure something just for fun. I am feeding to the 287 a 0.1Hz 1Vp-p signal. I am going set the the logger for 100 measurements with a 0.1s period.